Data Visualization
Pie Chart – used to illustrate proportionality.
Pivot table
Using the pivot table we created earlier with some careful selection, we want to highlight the position categories in the top row and the totals are in the bottom row. To do this:
- Select the categories at the top of the table.
- While holding down the control key on Windows or the Command key on Apple keyboards, select the bottom row with your mouse.
- We are going to copy this highlighted data to another location.
- Paste (paste-transpose) using the transpose feature so it creates columns instead of rows.
- Select and choose “insert pie chart” as before.
Sample Pivot Table
Bar Charts – compare category values with each other.
Scatter plots – useful for displaying bivariate numerical data. This means a data set with two variables, such as height and weight measurements for a list of human beings.
- Negative Correlation – If one variable increases as the other decreases, the two variables have a negative correlation. It is not an exact pattern, but you can see the direction
- Positive Correlation – If the data of both variables move up together, they have a positive correlation
Example Scenarios:

Pie - relative percentages of different fruits sold this month.
Bar - How does the number of apples, oranges, and pears sold this month compare to each other?
Line - How has the price for AAPL stock changed over time?
Scatter - Is there a relationship I can see between weight and age in a population?
Histogram - What is the frequency of salaries by millions across all major league baseball players?
Box Plot - What is the distribution of my numerical dataset from minimum to maximum, including the 1st, 2nd, and 3rd quartiles?
Histogram – a column chart that measures the frequency of data in a data set and specifically groups numerical values into bins we define.
Column Charts vs Histogram
- Recall that we previously created a column chart to compare counts of categories within a data set. This kind of chart answers a question like: how many players are there in each playing position in the league?
- But what if we want to ask the question: how many players made under $1 million in salary, and between $1 and $2 million, and between $2 and $3 million in salary? This kind of chart is called a histogram, and the groupings we choose such as, 1) all salaries between $1 and $2 million, and 2) salaries between $2 and $3 million, are the bins.
Analysis tool pack add-in:
- We’ll start with a method that works on both Windows and Mac using the histogram tool in the analysis tool pack add-in. Instructions for loading the analysis tool pack add-in are given in the Getting Started instructions.
- To create the histogram:
- Choose data analysis from the data menu on Windows or from the tools menu on Mac. Choose histogram, which opens a dialog.
- For the input range, select the data from the salaries column.
- For the bin range, select the bin intervals you’ve created.
- If you have a label at the top of your columns, click labels.
- For the output
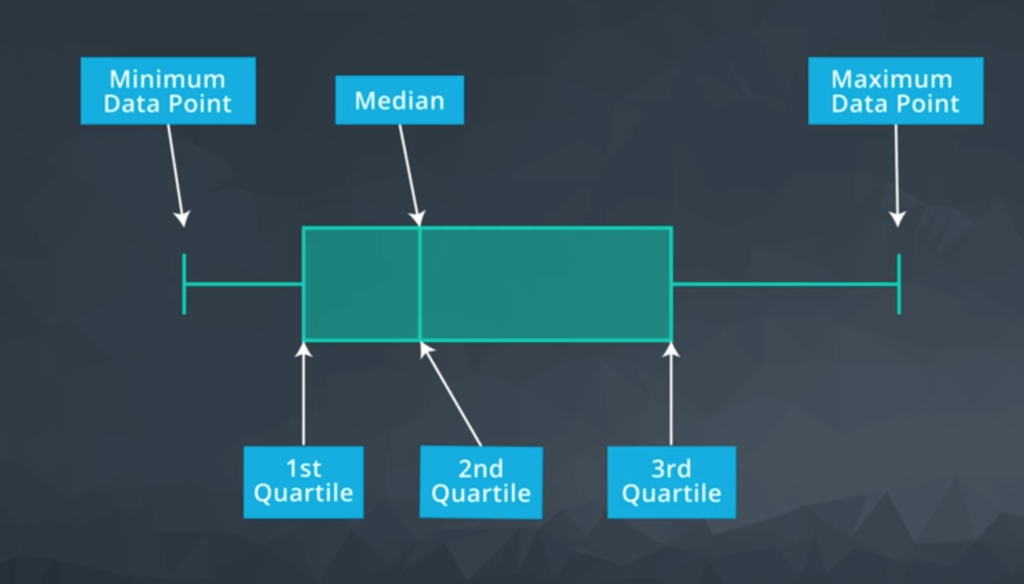
Box plot – visualization of statistical spread in a data set of values.
The five numbers summary
A traditional box plot is built using the five numbers summary. The five numbers summary consists of five values.
- maximum
- minimum
- 1st quartile
- 2nd quartile, aka ‘median’
- 3rd quartile

Where we make a box and whisker plot:
- Maximum becomes the tip of the upper whisker.
- Minimum becomes the tip of the lower whisker.
- The box represents the middle half of the data with a line where the median is.
Note: Excel will give us a bonus of six numbers in the summary by placing an X at the mean or average value of the set.
- Creating a box plot in Windows Excel 2016 is as easy as any other chart.
- Select the appropriate columns of data.
- Click insert in recommended charts.
- Click the box in the whisker chart. Remember that a box plot represents statistics for a single list of numbers. So, each list you select will be represented by its own box plot.
- Observe that the box plot visually gives a sense of the spread of the value list.
- Adjust the range so that you can see the plots a little better, if needed.
- Give the chart a title.
Presenting Data
1. What questions are we answering?
2. What patterns are we trying to show?
3. Who is the audience?
4. Overview or in-depth?
Leave a Reply