Projected Bookings per Sales Person
Sample Walk-through
First, we start with the number of opportunities we expect the salesperson to close annually.
- Average price per unit – the average price per unit or product for manufacturing.
- Average units per opportunity – the average number of units you can expect to sell per opportunity.
- Average contracts month per opportunity – the average length of time in months that sales contract can be for.
Next, we get to the average opportunity size, the average booking size we expect this salesperson to create on an annual basis
- Take the product of the three numbers above to get this number of bookings.
Next, we determine how to get to these bookings.
- Assume that the seller ramp or the length of time we can expect the new seller to reach full productivity after being hired is three months.
The hiring schedule in the model shows that once a person has been hired, a month from then, they will be employed and available to start generating leads.
- Create dummy coding for the projected hire date and after that, indicate a 0 for not hired and a 1 for a salesperson having been hired. Dummy coding refers to when you use a one and zero as stand-ins or dummies for the presence of something happening.
For the center productivity schedule, we want to generate the schedule of when a salesperson will be productive and we want to give that person three months of ramp time.
Finally, we get to our booking projections based on when a seller will be productive.
- Multiply the productivity dummy variable with the projected average booking and the expected monthly opportunities closed to get the monthly bookings generated by a salesperson.
To get the average opportunity (booking) size, we take the product of the following values:
- Average Price per Unit
- Average Units per Opportunity
- Average Contract Months per Opportunity
Formula:
Average\medspace Opportunity\medspace Size\medspace in\medspace Bookings=(Average \medspace Price\medspace Per\medspace Unit\medspace or\medspace PPU\medspace per\medspace Month)(Average\medspace Units\medspace Per\medspace Opportunity)(Average\medspace Contract\medspace Months\medspace per\medspace Opportunity)
Average Price Per Unit(PPU)/month * Average Units per Opportunity * Average Contract Months Per OpportunityScenario or Sensitivity Analysis
- commonly used for financial forecasting and rely on assumptions to provide some perspective on a company’s future.
- Best Case Scenario
- Base Case Scenario
- Weak Case Scenario
- the assumptions used in your model will dictate the scenario you are looking at and will directly impact forecasted income for the company.
Spreadsheet Tools
- Data validation is a spreadsheet tool that allows you to limit what values are accepted in a cell. You can create drop-down lists of items and restrict cell value to date ranges and numbers.
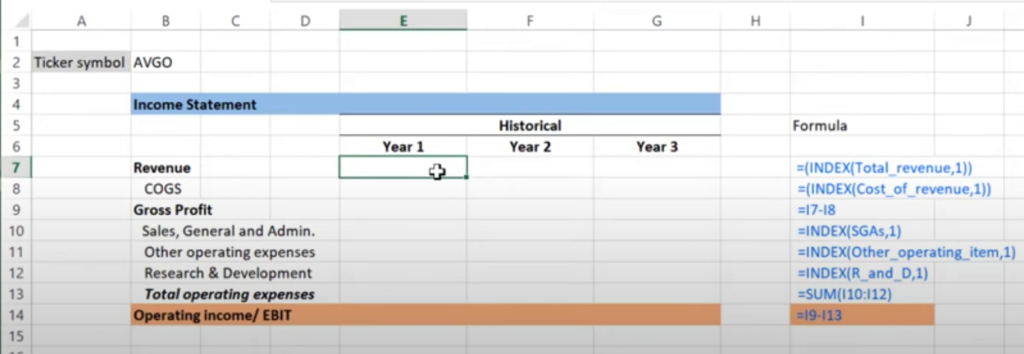
- INDEX is used when you want the cell to have a value chosen from a specified array and row number indicated within the INDEX function.
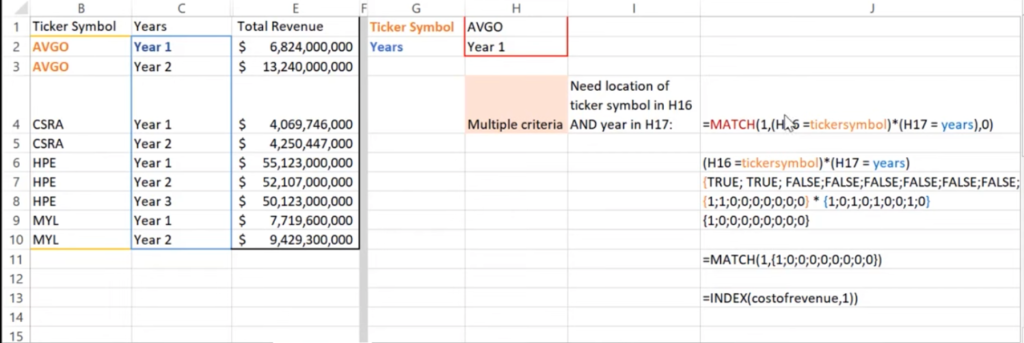
- MATCH is a LOOKUP function that can locate the position of the lookup value within an array only when it meets specific criteria defined in the MATCH function.
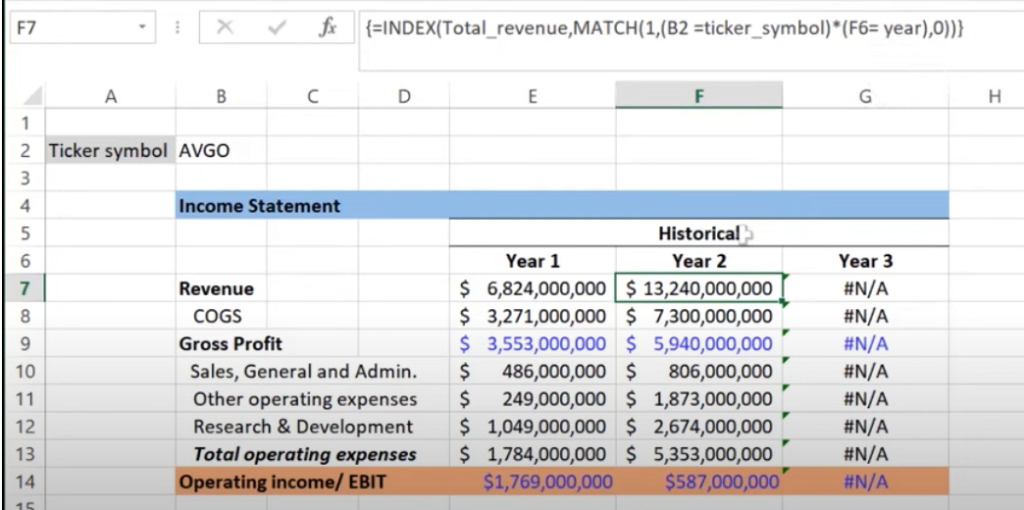
- INDEX AND MATCH together add a powerful feature for advanced formulas. Together they can give a value from an array (the purpose of the INDEX function) based on a numeric position (which is provided by the Match function).
- OFFSET. Here you can select a start point in the spreadsheet, and tell Excel to return a set of cells that are counted from the starting point.
Data Validation
- The purpose of data validation tools is to confirm that the values within the cell are validated against a criterion.
How to Create a Data Validation Dropdown List
To create a dropdown list using data validation, first create a pivot table:
- Highlight the rows of data you want in the dropdown
- Go to Pivot Table under the Insert tab to create a pivot table in a new worksheet (just hit OK)
- From the PivotTable Fields menu, select the name of the field/column you want
- You should now have a list of unique values with all duplication eliminated
- Copy and paste the list of unique values into a new cell and give that cell block a name, for example, company_list.
Now that we have a named list of unique values, the second step is to create a data validation feature:
- In a new worksheet, go to Data Validation under the Data tab
- Choose your validation criteria. In the video example, we used List
- For source, reference back to your named list. In our example, it was company_list
- Hit OK and now you should have a dropdown menu with only the unique values from your original data source
Pro Tip – You can use the Name Manager feature under the Formula tab to see all of the named boxes available in a spreadsheet and you can delete boxes, confirm or edit the source or range the box references.
Data Validation is all about limiting the scope of choices to those within a special range. Index
- takes a range of cells and returns a value from a cell in that range, based on the location of the cell holding that value. This location is provided in the INDEX function as either row number or column number.
The following is the generic syntax for INDEX:
- INDEX(array, row number, column number)
- array – the range of cells to look through
- row number and column number – give the location of the cell of the specific value wanted

Match
- provide the location of a defined lookup value within a given lookup array, and not the value itself.
The following is the generic syntax for MATCH:
- MATCH(lookup_value, lookup_array, match_type)
- lookup_value – the value you want to search for
- lookup_array – the array in which to search for the look_up value
- match_type – this can vary from 0 (match is an exact match to look_up value), 1 (match is less than or equal to lookup value), to -1 (match is greater than or equal to lookup value).

=INDEX(Total_revenue, 1)
=MATCH(H2, ticker_symbol, 0)

OR

=INDEX(Total_revenue, MATCH(H2, ticker_symbol, 0))
Additional Resource
Here is the link to the Google support documentation for using MATCH functions in Google Sheets.
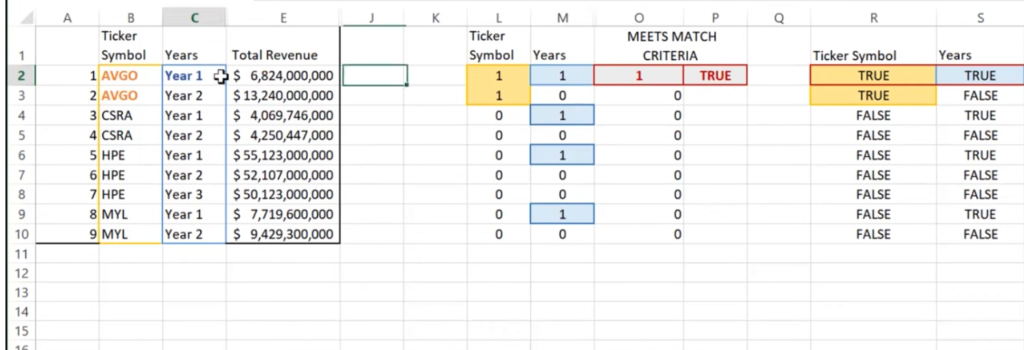
Index and Match with Multiple Criteria


=INDEX(array, MATCH(1, (condition 1)*(condition 2), [match_type]))Boolean Logic

Sample:
Offset
Financial Forecasting Process
We want to create three forecasting scenarios based on our assumptions:
- Best Case Scenario
- Base Case Scenario
- Weak Case Scenario
To do this, we need to walk through the following four steps to create our financial forecasting model:
- Calculate operating statistics
- Create the scenarios
- Create assumptions – this is where the OFFSET function will be used
- Develop the forecasted scenarios
Step 1 – Calculate operating statistics
Here we calculate operating statistics based on historical data from the income statement:
- Gross margin – (1- (Cost of good sold/Total revenue))
- Operating margin – Operating profit/Total revenue
- Revenue growth – (Current year revenue/Prior year revenue) -1
Step 2 – Create the scenarios
In this step, we create the three scenarios for each of our operating statistics because they will feed into the forecasting model. The numbers used in this step are based on:
- Historical data
- Business analyst’s knowledge of the business
- Research
- Assumptions about the business itself
A key question to ask here would be, “Do you expect revenue growth to stay the same or increase, and if so by how much?”
When working with financial forecasting, we typically base our assumptions on the historical financial performance of a company because we want to have a conservative approach. If we begin with a base case scenario that is not reflective of a company’s current performance, we can risk overestimating or underestimating future performance. This could potentially negatively impact our planning processes for business operations and future revenues. This could also risk providing an overly optimistic or even inaccurate view of a business to relevant stakeholders, investors, and potential investors.
Step 3 – Create assumptions
Excel Syntax
OFFSET function – return a range that is a specified number of rows and columns from a reference cell or range.
=OFFSET(cell_reference, number of rows to offset by, number of columns to offset by)Step 4 – Develop the forecasted scenarios
This is the final step in the financial forecasting process. Here we pull all of our work of the previous steps together to project out a financial picture of our company, based on one of our three scenarios:
- Best Case Scenario
- Base Case Scenario
- Weak Case Scenario
Formatting principles for Modeling
Here is a guide to best practices for formatting financial models.
- All inputs to the model should be colored BLUE. These include hard-coded values.
- All formulas and calculations should be coded in BLACK.
- Any links to other sheets within the workbook should be coded in GREEN.
- Any links to other files should be coded in RED.
Here is a good website to review the best practices:
Sample Exercise:
Leave a Reply